Your best quality dataset is handwritten. That's the problem.
By Aaron McClendon, Founder & CTO, Arkitekt AI
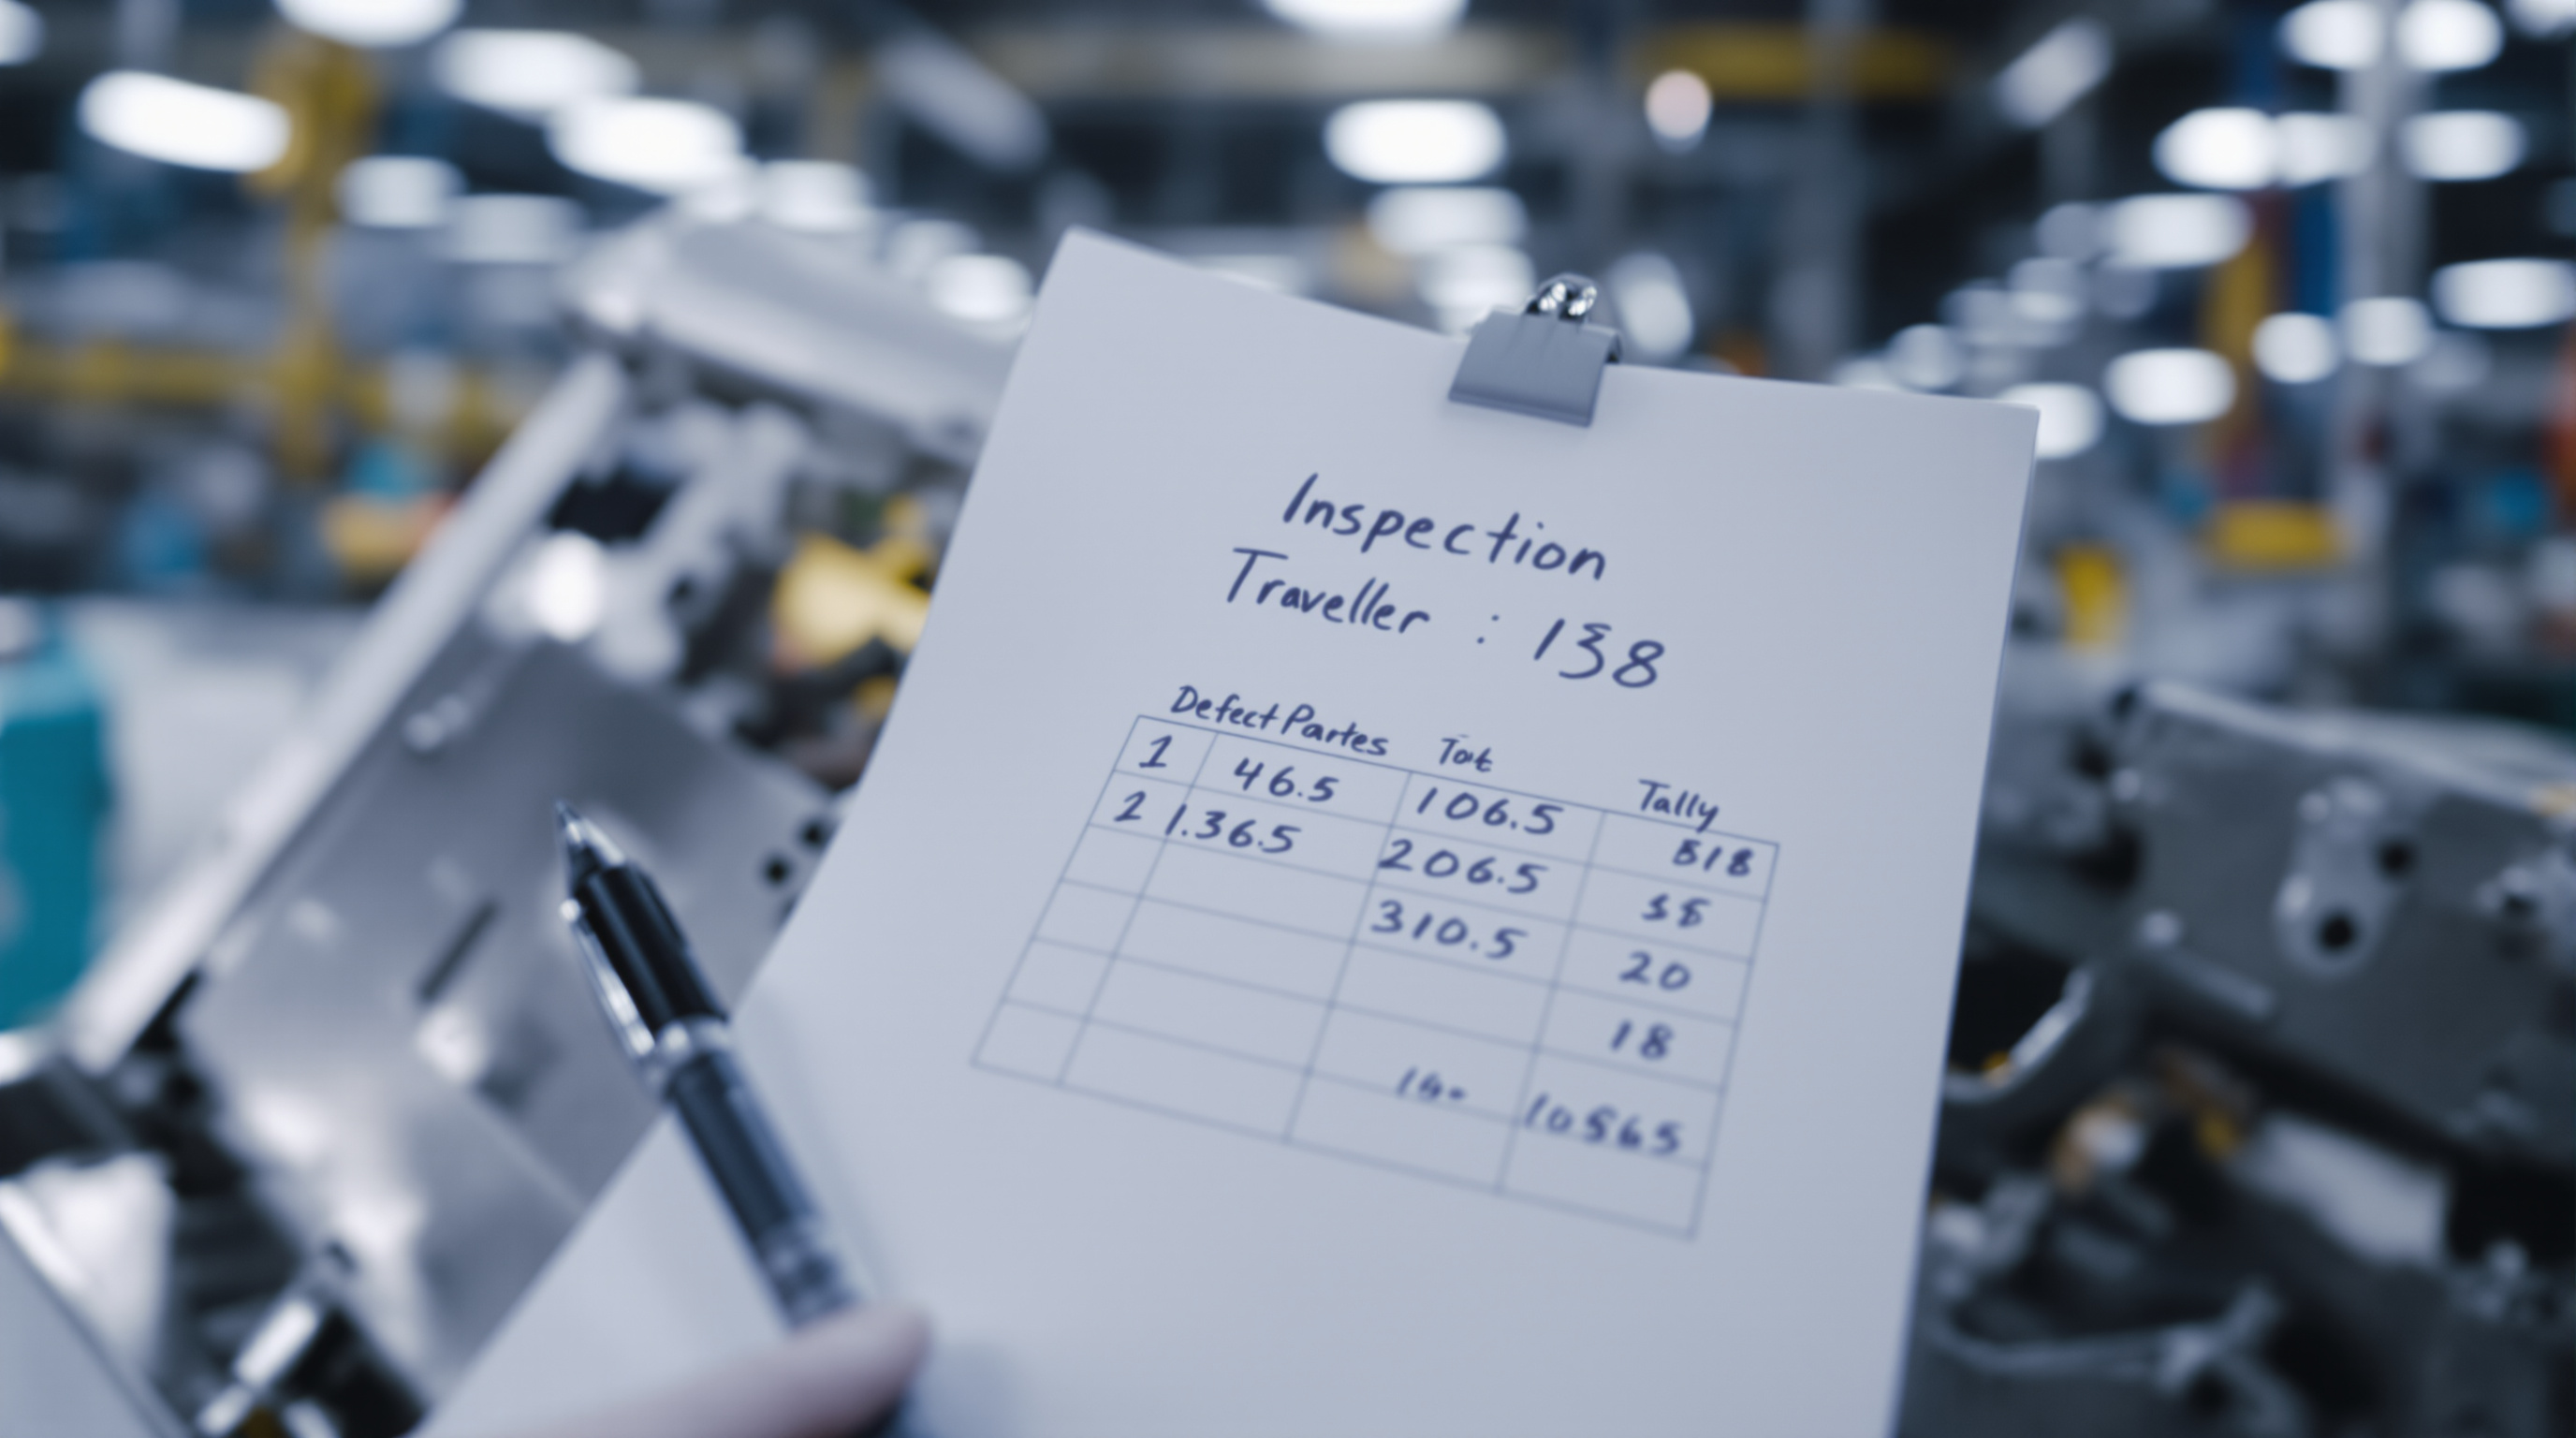
Walk any molding or stamping floor and you'll find the real quality database: a traveller taped to the tote, an inspection sheet on a clipboard by the press, an Excel file on the quality tech's desktop that only she knows the tabs for, and whatever the second-shift lead remembers about last Thursday's run.
That's not a joke. That's where the data lives. And it's why your first-pass yield analysis takes two weeks and still ends in a shrug.
Why it stays on paper
Travellers move with the part because QA signoff has to be physical. Excel wins because it's flexible and nobody has to file a ticket to add a column. Operator memory fills the gaps the forms don't cover ("that cavity's been dropping shorts since we swapped the hot runner in March"). None of these are irrational choices. They're the lowest-friction option for the person doing the work.
The problem shows up later, when somebody tries to answer a question.
What breaks when you try to analyze it
- Defect codes don't match across shifts. "Flash" on days is "parting line" on nights. Same defect, two buckets, no trend. - Timestamps are the shift, not the hour. You can't correlate a defect spike to a barrel zone drift if your finest-grained time key is "Tuesday PM." - Nobody writes down the good runs. You only have records for parts that failed inspection, which means you have no denominator. - Setpoint data lives in the historian. Defect data lives on paper. There's no join key between them, so the correlation work can't start.
Vendor overviews like CSP's piece on quality management software are right that pulling data off paper is step one. They're less honest that buying a QMS doesn't fix the underlying problem if the data was never structured to be joined to anything.
What it actually takes
Not a platform rollout. Start smaller.
1. Rewrite the defect code list with the people writing it down. Eight to twelve codes, agreed across shifts. Not forty. 2. Capture at the point of inspection. A tablet at the station beats transcribing a clipboard at end of shift. Retrocausal's writeup on assembly scrap makes the same point for manual lines — station-level capture is what makes defect attribution possible. 3. Stamp every record with job, machine, cavity, shift, and hour. That's your join key. 4. Pull the historian in on the same keys. Now you can ask real questions.
The payoff
When you can finally ask "what changed on the runs that produced shorts on cavity four," you stop guessing. We've seen teams discover a short-shot pattern that only shows up in the first 90 minutes after startup, tied to a specific barrel zone. That finding isn't in any report. It comes from joining two datasets that used to live in two different buildings.
The thing stopping you from analyzing your quality data usually isn't a missing platform. It's that the data was never captured in a form that could be joined to anything. Fix that first. The rest gets easier.
Arkitekt AI builds production-grade custom software on managed infrastructure — replacing the SaaS you've outgrown with systems you own. If you're paying for tools that almost fit, let's talk.
Source: “Inside Big Software's fight for its life,” Ashley Stewart, Business Insider, April 7, 2026.